|
|
Post by Admin on Oct 25, 2015 4:41:39 GMT
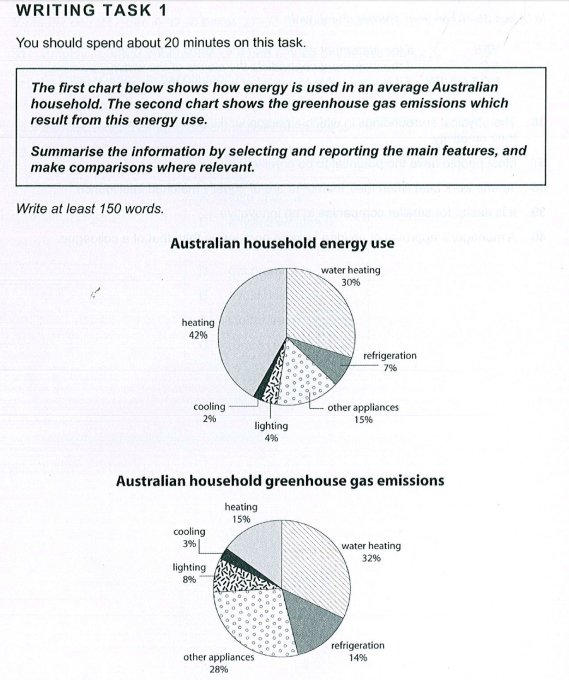
 The first chart shows what energy is used for in a typical Australian household and the second, the proportion of greenhouse gas produced as a result. According to the first pie chart, the majority of energy is used for heating and water heating, at 42% and 30% respectively. Cooling and lighting use the least energy at 2% and 4%, while refrigeration uses slightly more than these combined at 7%. Other appliances account for the remaining 15%. In terms of greenhouse gas emissions, the biggest contributors are water heating and other appliances at 32% and 28%. Heating, at 15%, and refrigeration, at 14%, are responsible for almost a third, with the balance being contributed by lighting (8%) and cooling (3%). Overall, there is no correlation between emissions and energy use with the exception of water heating, which accounts for around a third of energy use and produces approximately a third of emissions. For other categories, emissions are disproportionate to use. Heating consumes 42% of the energy in a typical Australian household, but is responsible for just 15% of emissions. Conversely, the smallest categories (cooling, lighting, refrigeration and other appliances) account for just over a quarter (28%) of total consumption, but are responsible for more than half (53%) the emissions. |
|